FTIR characterization of samples prepared under various conditions
Figure 1a displays the infrared spectroscopic analysis of henna extract and sample 10 B after calcination at 500 °C, 700 °C, and 900 °C and Fig. 1b is the magnification of…
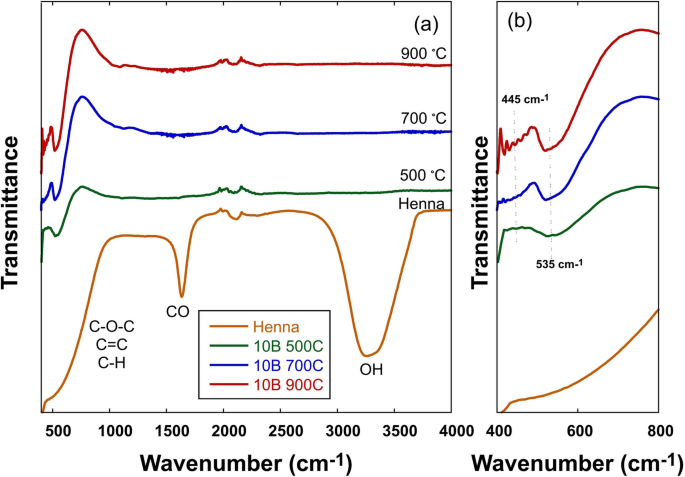
Figure 1a displays the infrared spectroscopic analysis of henna extract and sample 10 B after calcination at 500 °C, 700 °C, and 900 °C and Fig. 1b is the magnification of…