Device and neuron characteristics
The energy band diagram of the proposed TFET under different bias conditions is shown in Fig. 1b. The three different energy band plots represent: (1) the equilibrium state (\(V_{DS}\)=0.5 and \(V_{GS}\)=0) (2)…
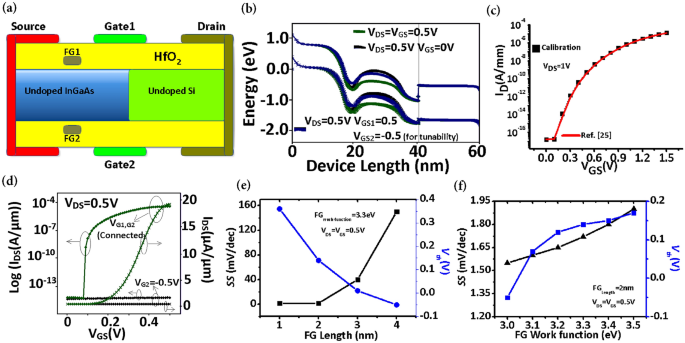
The energy band diagram of the proposed TFET under different bias conditions is shown in Fig. 1b. The three different energy band plots represent: (1) the equilibrium state (\(V_{DS}\)=0.5 and \(V_{GS}\)=0) (2)…