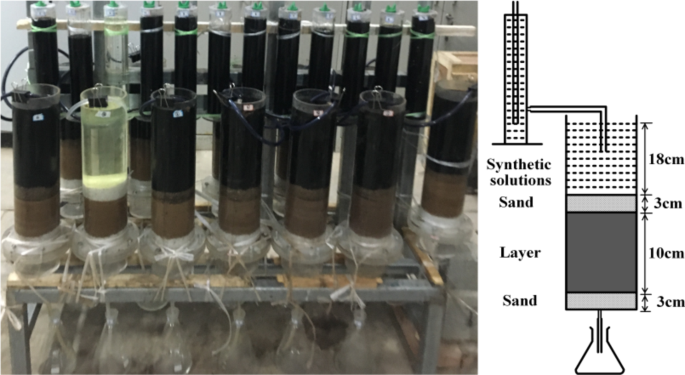
Hydraulic conductivity of modified loess
Figure 2 represents the curves of Ks of S, SF1, SF3, SF7, SG1, SG3, SG7, SN1, SN3 and SN7 over three months. As shown in Fig. 2a, adding fly ash to soil resulted in a significant fluctuation in hydraulic…

Figure 2 represents the curves of Ks of S, SF1, SF3, SF7, SG1, SG3, SG7, SN1, SN3 and SN7 over three months. As shown in Fig. 2a, adding fly ash to soil resulted in a significant fluctuation in hydraulic…