Descriptive statistics
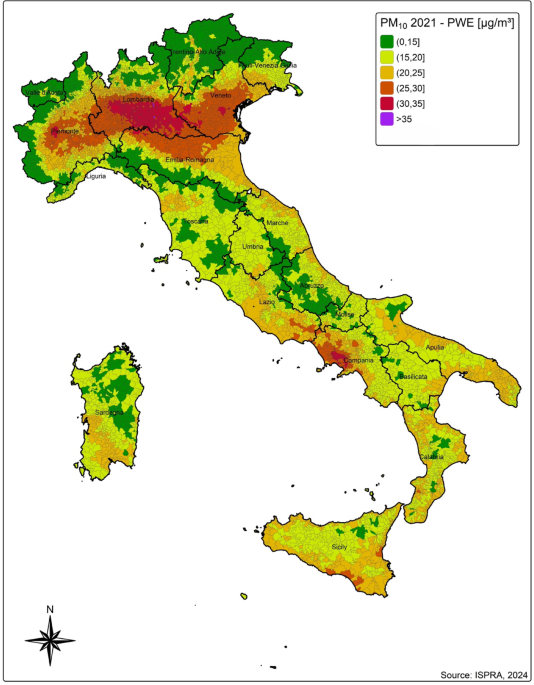
Tables 1 and 2 show the population-weighted exposure mean and percentiles to PM2.5 and PM10, over the 2013–2021 period.

Tables 1 and 2 show the population-weighted exposure mean and percentiles to PM2.5 and PM10, over the 2013–2021 period.