Phase diagram and spontaneous crystallisation
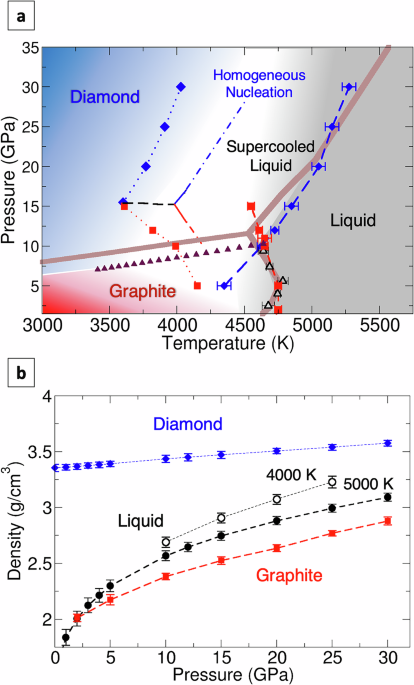
We first discuss the phase diagram of carbon in the region of the GDL triple point (Fig. 1a). Experimentally, the triple point was initially determined at T = 4100 ± 200 K, and…
We first discuss the phase diagram of carbon in the region of the GDL triple point (Fig. 1a). Experimentally, the triple point was initially determined at T = 4100 ± 200 K, and…