Structure and morphology of the as-synthesized samples
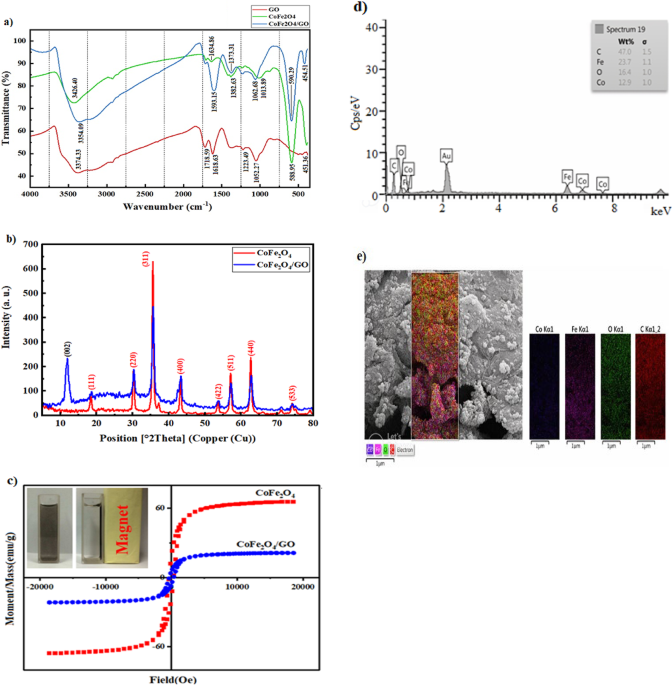
The FT-IR spectra of synthesized compounds is shown in Fig. 1a. The peaks reported at 3374.33 cm−1 for GO, 3426.40 cm−1 for CoFe2O4 and 3354.09 cm−1 for CoFe2O4/GO are all related to…
The FT-IR spectra of synthesized compounds is shown in Fig. 1a. The peaks reported at 3374.33 cm−1 for GO, 3426.40 cm−1 for CoFe2O4 and 3354.09 cm−1 for CoFe2O4/GO are all related to…