Figure 2 illustrate the integration curves derived from AFM images and the height distribution histograms for the Ni @ amorphous carbon films deposited at different deposition times. The height histogram is represented by the number of fragments…
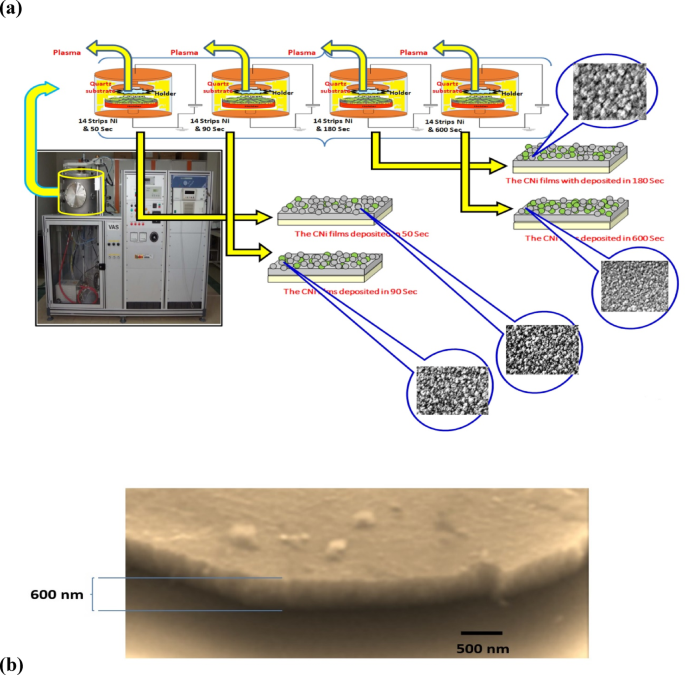
Effect of deposition rate on micromorphology analyses and optical parameters in amorphous carbon nickel thin films
