In vitro phantom studies
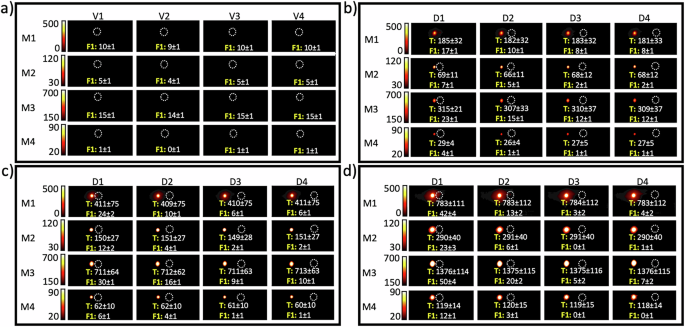
Figures 1–3 show MPI signal quantification for three different fiducials, labeled F1, F2, and F3, imaged under different conditions using the four scan modes and various spacing distances and target Fe concentrations.
Figures 1–3 show MPI signal quantification for three different fiducials, labeled F1, F2, and F3, imaged under different conditions using the four scan modes and various spacing distances and target Fe concentrations.