Combustion space temperature distribution
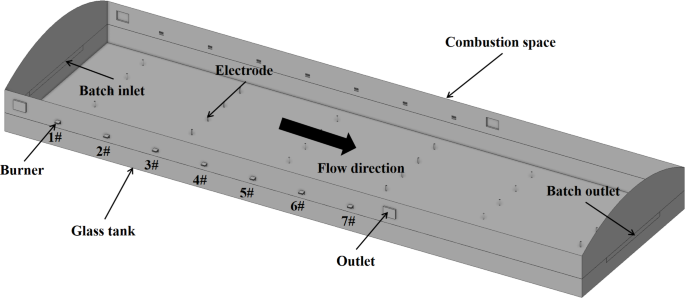
Figures 5 and 6 display the temperature and streamline distribution contour plots for the oxy-fuel electric boosting process and the electric boosting process at the burner plane (a) and the plane of…

Figures 5 and 6 display the temperature and streamline distribution contour plots for the oxy-fuel electric boosting process and the electric boosting process at the burner plane (a) and the plane of…