Figure 1 illustrates the diurnal variation of temperature in both local time and Coordinated Universal Time (UTC) across the globe, for January (panel a) and June (panel b), averaged over the period 1981–2022. The spatial snapshot is captured…
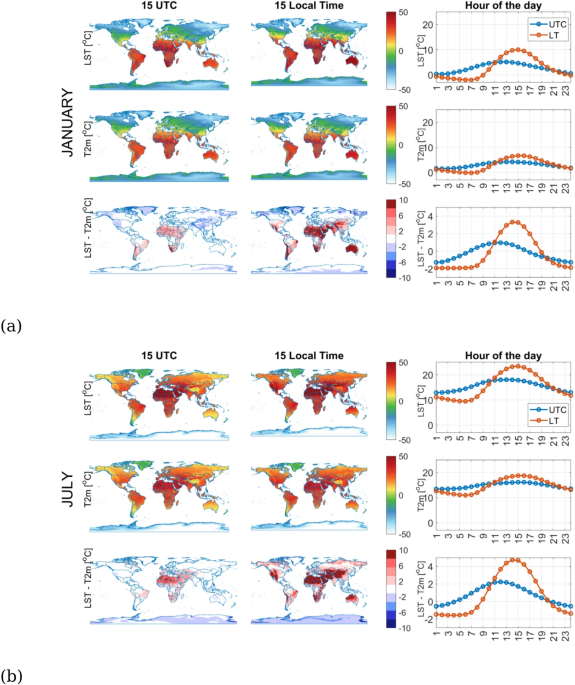
Figure 1 illustrates the diurnal variation of temperature in both local time and Coordinated Universal Time (UTC) across the globe, for January (panel a) and June (panel b), averaged over the period 1981–2022. The spatial snapshot is captured…