Characterization
FT-IR data
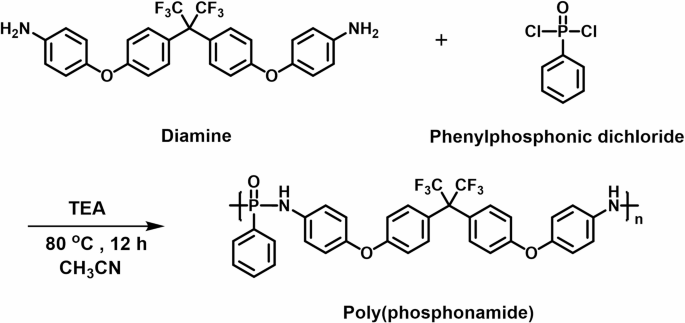
Figure 2a presents the FT-IR spectra of the PPD-F2. A broad peak observed around 3342 cm− 1 corresponds to N–H stretching vibrations, suggesting the presence of amine groups, potentially involved in the formation…

Figure 2a presents the FT-IR spectra of the PPD-F2. A broad peak observed around 3342 cm− 1 corresponds to N–H stretching vibrations, suggesting the presence of amine groups, potentially involved in the formation…